가상화폐 투자마법 공식 발췌 (전체코드는 아래 파일에 있습니다)

투자전략 : 가상화폐 분산투자 + 현금 비중 90%
아주 간단한 전략이다. 투자에 시간을 많이 쓰고 싶지 않은 분께 추친드리는 전략이라고 책에는 적혀 있다.
투자대상 : 아무 가상화폐나 몇 개 선택
투자기간 :
거래비용 : 0.2%
투자전략
* 선택한 가상화폐에 동일한 금액을 분산투자
* 단, 자산의 10%만 가상화폐에 투자 ex) 5개 가상화폐에 투자할 경우 각 화폐에 자산의 2% 투자)
* 가상화폐 자산이 총 50% 상승해서 자산 대비 가상화폐 비중이 15%를 넘어서면 일부를 팔아서 다시 현금 90%, 가상화폐 10%로 비중을 맞춤
* 가상화폐 자산이 총 33%하락해서 자산대비 가상화폐 비중이 작아지면 가상화폐를 매수해 다시 현금 90%, 가상화폐 10%로 비중을 맞춤
가상화폐 자산이 총 50% 상승하면?
| 시작일 | 한 달 후 | 조정 | ||
| 가상화폐 | 비트코인 | 250 | 700 | 262.5 |
| 이더리움 | 250 | 100 | 262.5 | |
| 리플 | 250 | 500 | 262.5 | |
| 비트코인 캐시 | 250 | 200 | 262.5 | |
| 합계 | 1,000 | 1,500 | 1,050 | |
| 비중 | 10% | 14.28% | 10% | |
| 현금 | 9,000 | 9,000 | 9,450 | |
| 총자산 | 10,000 | 10,500 | ㅌ500 | |
반대로, 가상화폐 자산 가격이 총 33% 하락하면?
| 시작일 | 한 달 후 | 조정 | ||
| 가상화폐 | 비트코인 | 250 | 200 | 241.67 |
| 이더리움 | 250 | 180 | 241.67 | |
| 리플 | 250 | 120 | 241.67 | |
| 비트코인 캐시 | 250 | 167 | 241.67 | |
| 합계 | 1,000 | 667 | 966.7 | |
| 비중 | 10% | 6.9% | 10% | |
| 현금 | 9,000 | 9,000 | 8,700.3 | |
| 총자산 | 10,000 | 9,667 | 9,667 | |
필요한 데이터를 불러온다
import pybithumb
import pandas as pd
import numpy as np
각 코인별로 시작일을 구해보자. 최대한 백테스팅 기간을 길게 해야되기 때문에, 데이터가 가장 많이 존재하는 코인을 고르자
# ticker를 불러오자
tickers = pybithumb.get_tickers()

start_date_list = [] # 데이터시작일 저장 리스트
end_date_list = [] # 마지막일 저장 리스트

for ticker in tickers:
    df = pybithumb.get_ohlcv(ticker)

    start_date_list.append(str(df.index[0]))
    end_date_list.append(str(df.index[-1]))

    print(ticker, start_date_list[-1], end_date_list[-1])

ticker_df = pd.DataFrame({"tickers" : tickers, "start_date" : start_date_list, "end_date" : end_date_list})

ticker_df
책에서는 비트코인, 라이트코인, 리플, 대시를 사용하였다고 한다. 하지만, pybithumb으로는 BTC는 2013년부터 데이터를 가져올 수 있지만, 이더리움(ETH)은 2016, 라이트코인(LTC) 2017년, 리플(XRP)도 2017년부터 데이터를 가져올 수 있다.

그러면, 일단 비트코인 하나로만 가지고 해보자. 다른 코인은 충분한 데이터가 없다.
btc_df = pybithumb.get_ohlcv('BTC')

# 처음 시드머니 : 1억
initial_capital = 100000000
btc_count = 0 # 비트코인 개수
total_capital = 0 #
investing_weight = 0.1
cash = 0
fee = 0.002
btc_invested = 0# 가상화폐 자산
initial_btc_invested = 0 # 리밸런싱 후 가상화폐 자산

btc_close_price_list = []
total_capital_list = []

for i in range(len(btc_df)):

    yesterday_btc_close = btc_df.iloc[i-1]['close']
    btc_close = btc_df.iloc[i]['close']


    # 첫날인 경우 전체 1억에서 10%를 가지고 비트코인을 매수한다
    if i == 0:
        # 현금은 90% 남긴다
        cash = initial_capital * (1 - investing_weight)

        # 비트코인에는 10%만 투자한다(수수료비용은 차감한다)
        btc_invested = initial_capital * (investing_weight) * (1 - fee)
        initial_btc_invested = btc_invested

        total_capital = cash + initial_btc_invested

    # 첫날이 아닌 경우
    else:
        # 비트코인이 오른만큼,  가상화폐 자산(btc_invested)도 상승한다
        btc_invested *= (btc_close / yesterday_btc_close)

        # 총금액은 현금과 비트코인 투자한 금액
        total_capital = cash + btc_invested


        # 만약 가상화폐 자산이 50% 상승했으면, 리밸런싱을 진행한다
        if btc_invested >= initial_btc_invested * 1.5:

            print("rebal1")

            # 현금은 90% 남긴다
            cash = total_capital * (1 - investing_weight)

            # 비트코인에는 10%만 투자한다(수수료비용은 차감한다)
            btc_invested = total_capital * (investing_weight) * (1 - fee)
            initial_btc_invested = btc_invested

            # 총금액은 현금과 비트코인 투자한 금액
            total_capital = cash + btc_invested


        # 만약 가상화폐 자산이 33% 하락했으면, 리밸런싱을 진행한다
        elif btc_invested <= initial_btc_invested * 0.77:

            print("rebal2")

            # 현금은 90% 남긴다
            cash = total_capital * (1 - investing_weight)

            # 비트코인에는 10%만 투자한다(수수료비용은 차감한다)
            btc_invested = total_capital * (investing_weight) * (1 - fee)
            initial_btc_invested = btc_invested

            # 총금액은 현금과 비트코인 투자한 금액
            total_capital = cash + btc_invested


    btc_close_price_list.append(btc_close)
    total_capital_list.append(total_capital)

    print(btc_close, total_capital)
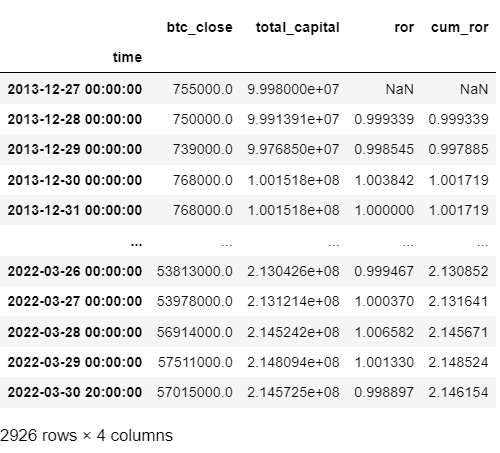
수익률을 확인해보자. 수익률은 전일 pct_change() 함수를 사용하면 쉽게 구할 수 있다.
ror_df = pd.DataFrame({"btc_close" : btc_close_price_list, "total_capital" : total_capital_list}, index = btc_df.index)

ror_df['ror'] = ror_df['total_capital'].pct_change() + 1
ror_df['cum_ror'] = ror_df['ror'].cumprod()

ror_df
수익률을 확인해보면 2배정도 올랐다. 엄청나게 안 좋은 결과가 나왔다. Buy & Hold를 했으면 755000원인 비트코인 가격이 57015000원이 되었고, 약 75배정도 올랐다.
그래프를 그려보면, 그래도 2018년에서 2019년은 선방하는 모습을 보이고, 2020~2021년에 좋은 수익률을 보여준다.
import matplotlib.pyplot as plt

plt.plot(ror_df['cum_ror'])

'가상화폐 퀀트 전략' 카테고리의 다른 글
| # 트레이딩 전략 5 : 슈퍼상승장 + 변동성 조절 (1) | 2022.04.04 |
|---|---|
| # 트레이딩 전략 4 : 이동평균 + 현금 비중 80% 이상 (0) | 2022.04.04 |
| # 트레이딩 전략 2 : 오버나잇(Overnight) 매수 (0) | 2022.03.24 |
| # 트레이딩 전략 1 : 저가매수, 고가매도 (buy low, sell high) (0) | 2022.03.15 |
| API를 이용해 비트코인 시세 가져오기 - pybithumb (0) | 2022.03.14 |


댓글